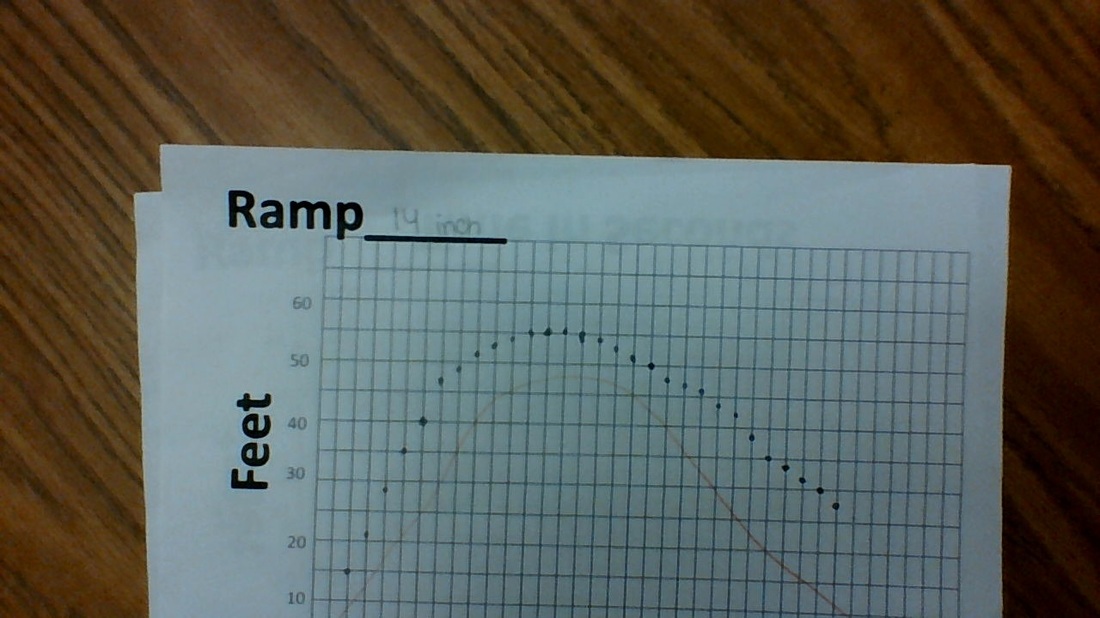
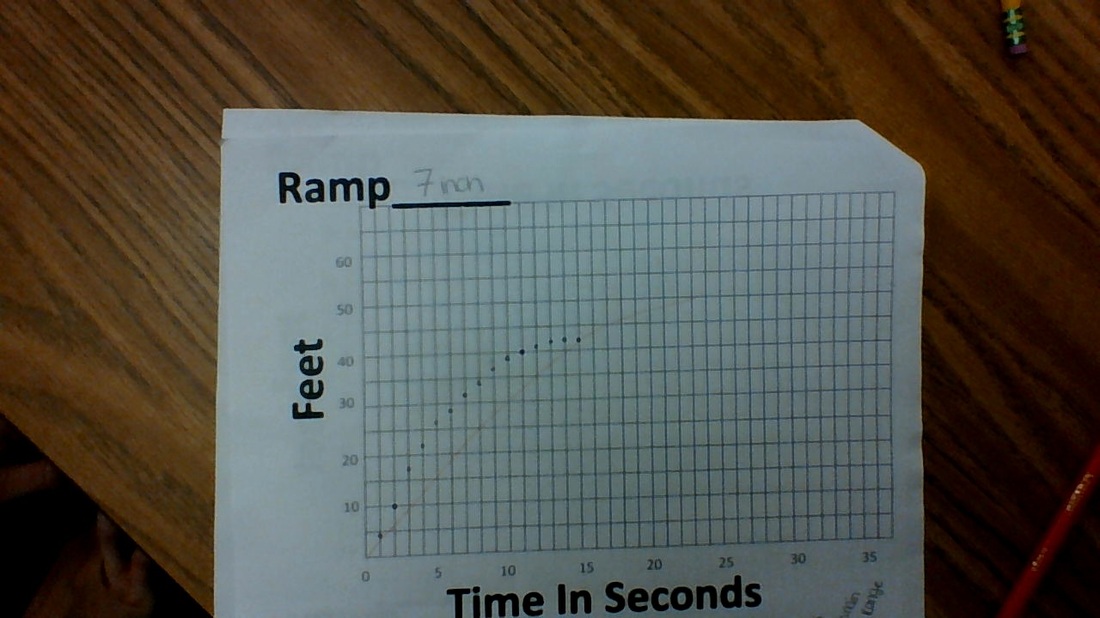
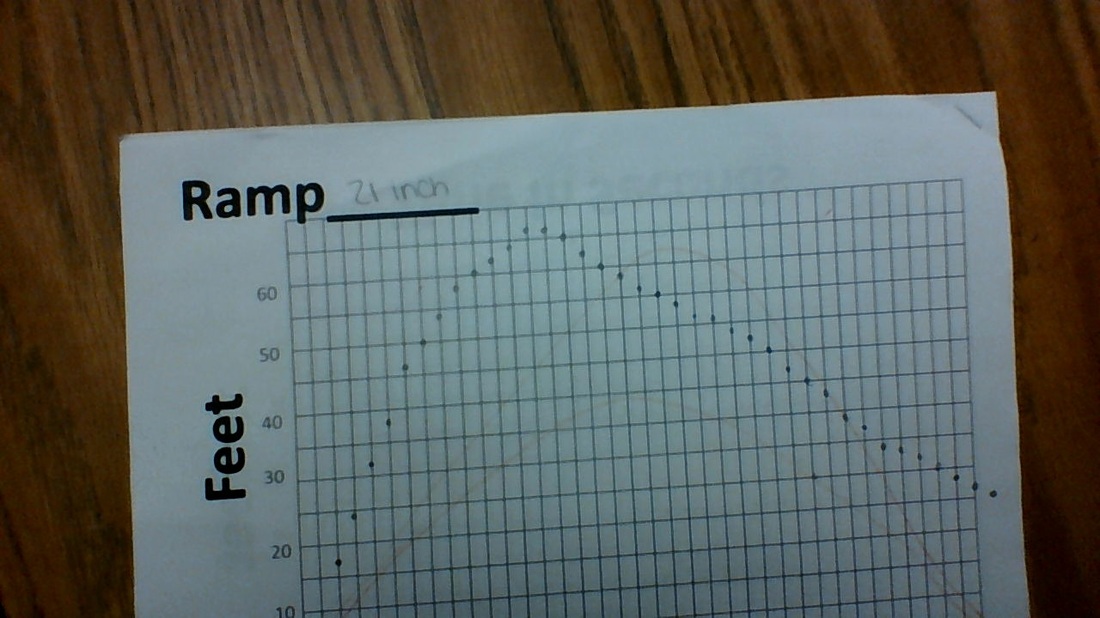
Today our teacher showed us a video of a skateboard going down a ramp into his driveway. There were three different ramps used. A 21, 14,and 7 inch ramp. After watching the video we were told to predict the graph for the skateboard for each video. As shown above, my predictions were not close in the beginning but towards the end I got better at predicting. In my 21 in ramp, I knew the graph was suppose to go to 65 feet from watching the video. I didn't know how quickly it was going, but the skateboard moved more quickly than I had predicted. In my 14 inch and 7 in graphs my predictions got a lot closer. The 21 inch graph has a higher maximum than the 14 inch and 14 inch ramps. As the ramps get smaller, the minimum does too, although the 7 inch ramp doesn't even have a minimum. The domain for the 21 in ramp was [0-37], and the range was [0-66]. For the 14 in ramp graph the domain [0-36] and the range is [0-55]. The 7 in ramps domain was [0-15] and the range was [0-43]. When looking at all three graphs they all contain a maximum, but each maximum is different. All three graphs start at zero, therefore their minimums are zero. For example, the maximums of the 14 in ramps and the 7 in ramps are 55, and 43ft. The 21 in ramp has the biggest maximum because the ramp is higher and that causes the skateboard to move progressively faster. The graph is rising the fastest in the 21 in ramp because the ramp is higher than the other two. In all three of the graphs, they rise quite quickly, and at their own speeds as the ramp gets smaller but decelerate at the same speed because it's the same driveway .
0 Comments
Leave a Reply. | AuthorWrite something about yourself. No need to be fancy, just an overview. ArchivesFebruary 2015 Categories |
 RSS Feed